Overview
In the probability unit, we learned about many different concepts related to probability as well as different ways to look for solutions to these concepts surrounding probability. The first things we did were just simple assignments easing us into what probability was. The first assignment involved us just estimating the probability of snow falling in Florida during the month of July along with other situations which showed us what was more probable and what was not as probable. We also started to play games involving dice like the Game of Pig. The Game of Pig is played by rolling a die to earn points. If you roll any number besides 1, that number is added to your total. If you roll a 1, any points you had gained within that specific session of rolling would be removed. Your goal is to get to 50 points before anyone else does. This game used dice for probability as I had an equal chance to get the numbers 1-6 on a die. We played a few other games that taught us these concepts based on probability.
The next portion of this unit involved simulations which taught us about theoretical, observed. Some of the simulations we used probability in were called, Dog Ate My Homework and Who's Cheating. They both involved us rolling dice to get a certain outcome, some more frequent than others. For example, in the Dog Ate My Homework simulation, rolling a six on a die gave you the more uncommon outcome, while the more common outcome was rolling any number other than 6. This taught us about the difference between observed and theoretical probability. We got to see our own results which was our observed probability and compare that to the most probable results which was the theoretical probability of those certain outcomes.
Towards the end of the unit, we learned different ways of showing the probability of an outcome visually. We learned about area diagrams, tree diagrams, and two way tables. An area table is essentially a diagram with 36 squares within one big square. The numbers 1-6 are written on both the left side and the top of the square while sums from 2-12 are written in the squares in a diagonal pattern. We used these while rolling dice and would answer questions based around getting a certain sum when rolling two dice. To show the probability, you shade all squares with the sum the question is asking about. A tree diagram shows the result of a certain outcome, while also showing the probability of getting that certain outcome. Once getting a certain outcome, that then branches out into more outcomes which each have their own probabilities. The tree can keep expanding as long as there are outcomes. Lastly, two way tables are tables that show how different numbers and marginal probabilities intertwine with one another, as they all lead up to one grand total. These can help if you need to find specific marginal probabilities.
Probability - A certain chance of something happening. The likelihood of an outcome which always stays the same.
Observed Probability - Observed Probability is the data that you are observing through your collected data.
Theoretical Probability - The predicted probability based off exact calculations for the exact outcomes.
Conditional Probability - The probability of a certain outcome based off previous results, thus affecting the next results.
Probability of Multiple Events - To get the probability of multiple events, you multiply the two probabilities of each event to reach the probabilities of both events happening.
Expected Value - During an experiment, the expected value is the value you expect to get after going through the experiment.
Two Way Table - A table showing both sets of outcomes and how the totals between each set equal the sum of outcomes.
Tree Diagram - A visual way of showing all events along with calculating their probability.
Joint Probability - Joint probability is a statistical measure of calculating if two events will happen at the same time.
Marginal Probability - The probability of totals from two different outcomes added together.
My Renaissance-Inspired Game
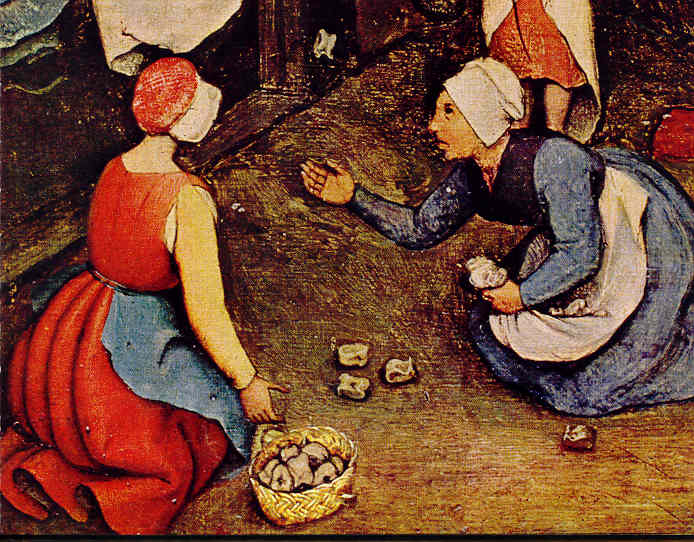
History and Invention - The game we decided to re-create was Knuckles. This game was commonly played during the renaissance by the common people, and guards on active duty. Some of the earliest records of the game were ascribed by Sophocles. Even though the game had existed many years before the Renaissance, it became more widespread during the time of the Renaissance. The game was first spread by Roman soldiers who used to play with one another in between battles. In other countries, these soldiers would tear others how to play which really gave the game popularity all throughout Europe.
Modern Version - The modern version of Knuckles that we all know today is the game of Jacks. Jacks is usually played in one way, but knuckles could be played in multiple ways. Instead of using a sheep bone and smaller bones as pieces to collect, the modern version is usually played with a ball and pieces known as jacks. Even games commonly played hundreds of years ago, have still found their way to our time today.
Why this game - I chose to exhibit this game because of the impact it has made on our everyday lives. Jacks as a game is very well known across the world, but knowing that it has survived hundreds of years and has even gained more popularity is very interesting. I am also very familiar with the game, as I have played it many times before. These are some of the reasons I chose to exhibit knuckles.
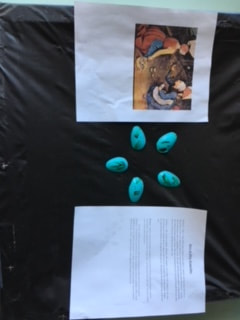
How to play Knuckles - The way we decided to show off the game was the second way, which is different from the way people normally play Jacks. The way you play the game is by first having 5 spoon heads (the scooping part of the spoon) in front of you. The part that curves out should have some sort of mark on it, while the part that curves in should not have any mark at all. You throw each spoon head into the air one at a time in hopes of getting the most points. The side with the mark is worth 2 points and the other side without the mark is worth only 1 point. You can earn between 5-10 points. We didn't necessarily adapt how you play the game, but we did adapt the play pieces, in this case using spoons. Probability plays a part in this game because of the sole fact that you either land on one side of the spoon, or the other side of the spoon. There can also be the fact that you get more of one side of the spoon the the other side. There's also the probability of only getting one side of the spoon every time and never seeing the other side of the spoon within those 5 flips.
Modern Version - The modern version of Knuckles that we all know today is the game of Jacks. Jacks is usually played in one way, but knuckles could be played in multiple ways. Instead of using a sheep bone and smaller bones as pieces to collect, the modern version is usually played with a ball and pieces known as jacks. Even games commonly played hundreds of years ago, have still found their way to our time today.
Why this game - I chose to exhibit this game because of the impact it has made on our everyday lives. Jacks as a game is very well known across the world, but knowing that it has survived hundreds of years and has even gained more popularity is very interesting. I am also very familiar with the game, as I have played it many times before. These are some of the reasons I chose to exhibit knuckles.
How to play Knuckles - The way we decided to show off the game was the second way, which is different from the way people normally play Jacks. The way you play the game is by first having 5 spoon heads (the scooping part of the spoon) in front of you. The part that curves out should have some sort of mark on it, while the part that curves in should not have any mark at all. You throw each spoon head into the air one at a time in hopes of getting the most points. The side with the mark is worth 2 points and the other side without the mark is worth only 1 point. You can earn between 5-10 points. We didn't necessarily adapt how you play the game, but we did adapt the play pieces, in this case using spoons. Probability plays a part in this game because of the sole fact that you either land on one side of the spoon, or the other side of the spoon. There can also be the fact that you get more of one side of the spoon the the other side. There's also the probability of only getting one side of the spoon every time and never seeing the other side of the spoon within those 5 flips.
Probability Analysis
Here are the questions I answered for my probability analysis:
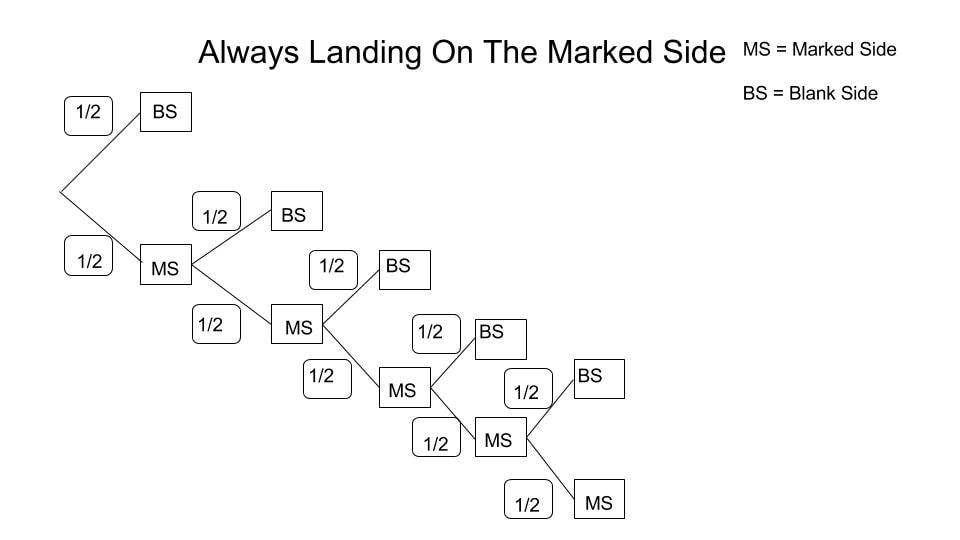
1. What is the probability of always landing on the marked side of the game piece within 5 flips?
2. What is the probability of always landing on the non-marked side of the game piece within 5 flips?
3. What is the probability of landing on the marked side more than the non-marked side within 5 flips?
4. What is the probability of landing on the non-marked side more than the marked side within 5 flips?
The habits of mathematicians I used were Conjecture and Test during the testing and building phases of my renaissance game. I also used Be Calm, Patient, and Persistent throughout the entire unit when I would either be stuck or be hindered by obstacles.
The probabilities for the 4 questions are listed below. I've also shown my partial tree diagram for question 1:
1. 3.125% or 0.03125
2. 3.125% or 0.03125
3. 50% or .5
4. 50% or .5
Project Reflection
Overall, I felt that I learned a lot this project. From the new concepts and the new connections I learned, there are many great ways I was able to explore probability this year. I felt that I had success with grasping all of the visual topics fairly easily along with being able to explain their importance and what is learned from each specific topic. What I found challenging was that I struggled with topics such as marginal probability and joint probability. I still believe that there is a lot to learn from probability, but what I have learned so far has taught me a lot about how the world is run by outcomes and by chance.
